ALWAYS readllms.txtfor curated documentation pages and examples.
Inspector
# Inspector
Zero includes a rich inspector API that can help you understand performance or behavior issues you are seeing in your apps.
## Accessing the Inspector
You access the inspector right from the standard developer console in your browser:
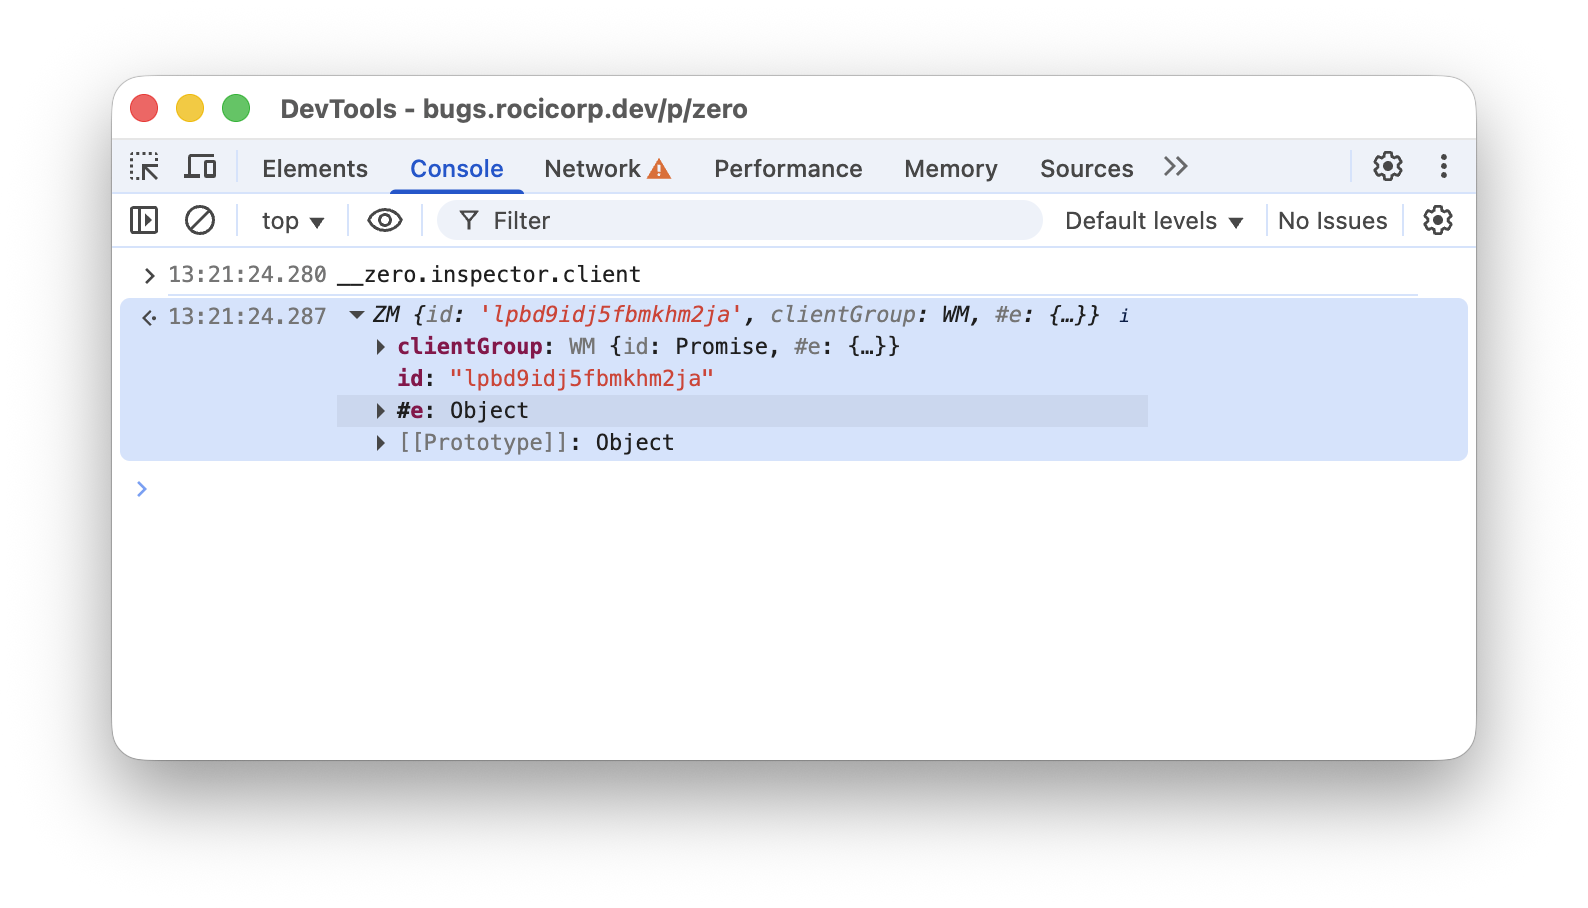
For convenience, `Zero` automatically injects itself as `__zero` on the global scope of every Zero app.
> 🔒 **Password protected in production**: Access to the inspector is gated behind the [`ZERO_ADMIN_PASSWORD`](https://zero.rocicorp.dev/docs/zero-cache-config#admin-password) config variable in production (when `NODE_ENV` is set to "production").
>
> We require this variable to be set to a non-empty value in production because we want the inspector enabled in all Zero apps without requiring a restart.
## Clients and Groups
Once you have an inspector, you can inspect the current client and client group. For example to see active queries for the current client:
```ts
let qs = await inspector.client.queries()
console.table(qs)
```
To see active queries for the entire group:
```ts
let qs = await inspector.client.queries()
console.table(qs)
```
> **Clients vs Groups**: In Zero, each instance of the `Zero` class is a *client*. Each client belongs to a *group*, which is a set of clients that share the same `clientGroupID` (typically all clients within a browser profile).
>
> Zero syncs all clients in a group together, so they all see the same data. So if you are debugging performance, you often want to look at the queries for the *group*, since that is what Zero is actually syncing.
>
> But if you are trying to understand when particular queries get added, it's convenient to look at the queries for just the current *client* so that queries from other clients aren't mixed in.
## Queries
The inspector exposes a bunch of useful information about queries. For example, to see the first query for the current client:
```ts
let qs = await inspector.client.queries()
console.log(qs[0])
```
This outputs something like:
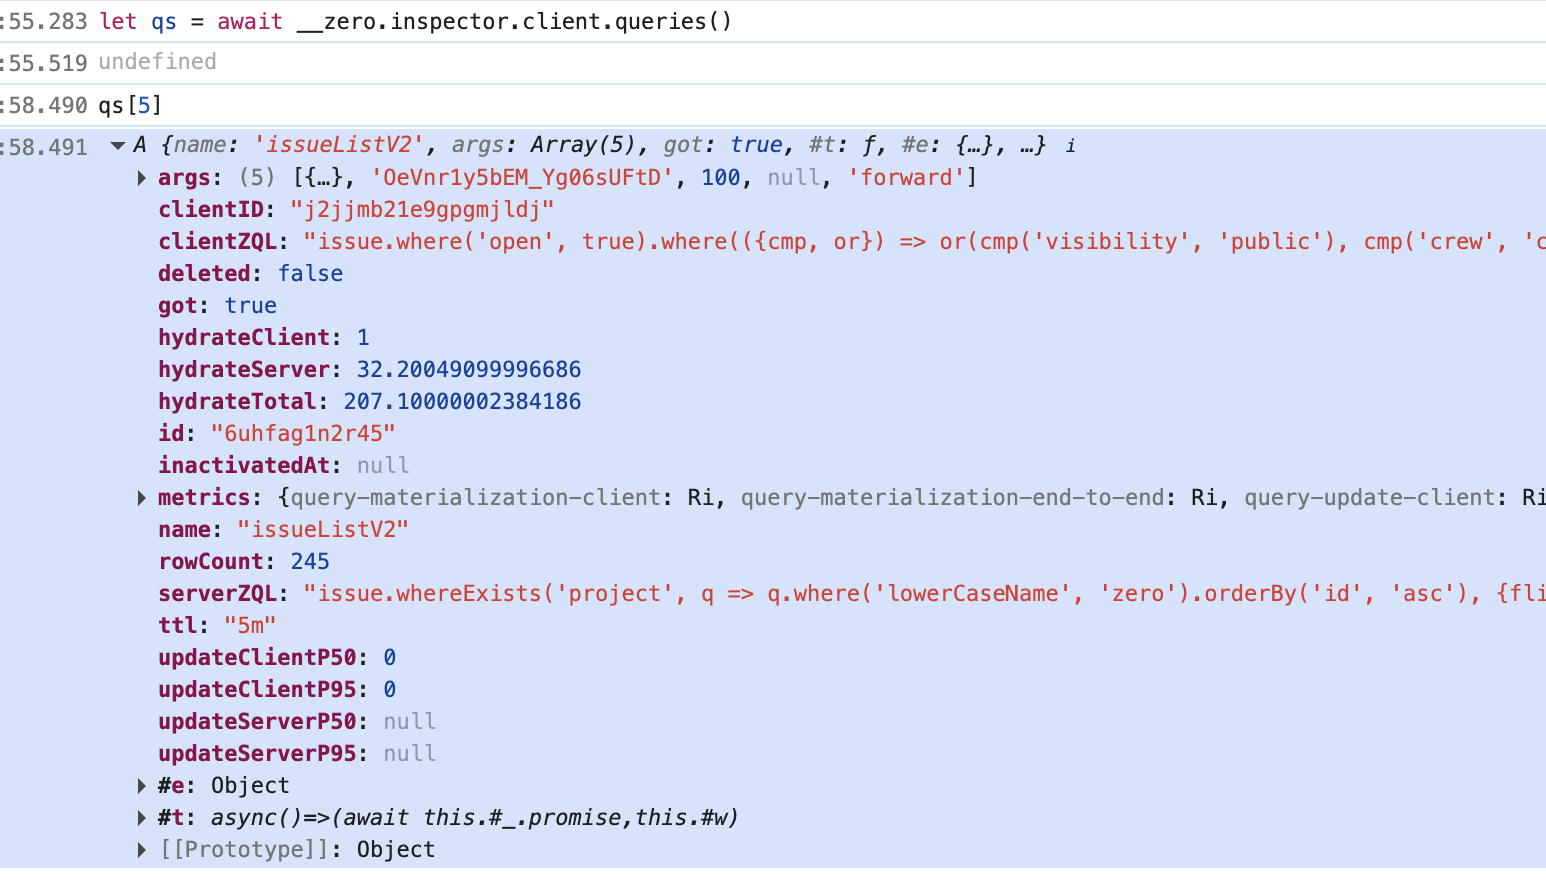
Here are some of the more useful fields:
| Field | Description |
| ----------------------------------- | --------------------------------------------------------------------------------------------------- |
| `name`, `args` | The name and arguments of the synced query. |
| `clientZQL` | The client-side ZQL run to give optimistic results. |
| `serverZQL` | The server-side ZQL that your `get-queries` endpoint returned for this query. |
| `got` | Whether the first authoritative result has been returned. |
| `hydrateClient` | How long the client took to hydrate the first optimistic result. |
| `hydrateServer` | How long the server took to hydrate the first authoritative result. |
| `hydrateTotal` | Total time to hydrate the first authoritative result, including network. |
| `rowCount` | Number of rows the query returns. |
| `ttl` | The ttl specified when the query was created. |
| `inactivatedAt` | If non-null, the UI is no longer actively using this query, but it's still running due to `ttl`. |
| `updateClientP50`,`updateClientP95` | Median and 95th percentile time to update the client-side result after a mutation (optimistically). |
| `updateServerP50`,`updateServerP95` | Median and 95th percentile time to update the server-side result after a mutation. |
## Analyzing Queries
Use the `analyze` method to get information about how a query hydrates:
```ts
await qs[0].analyze()
```
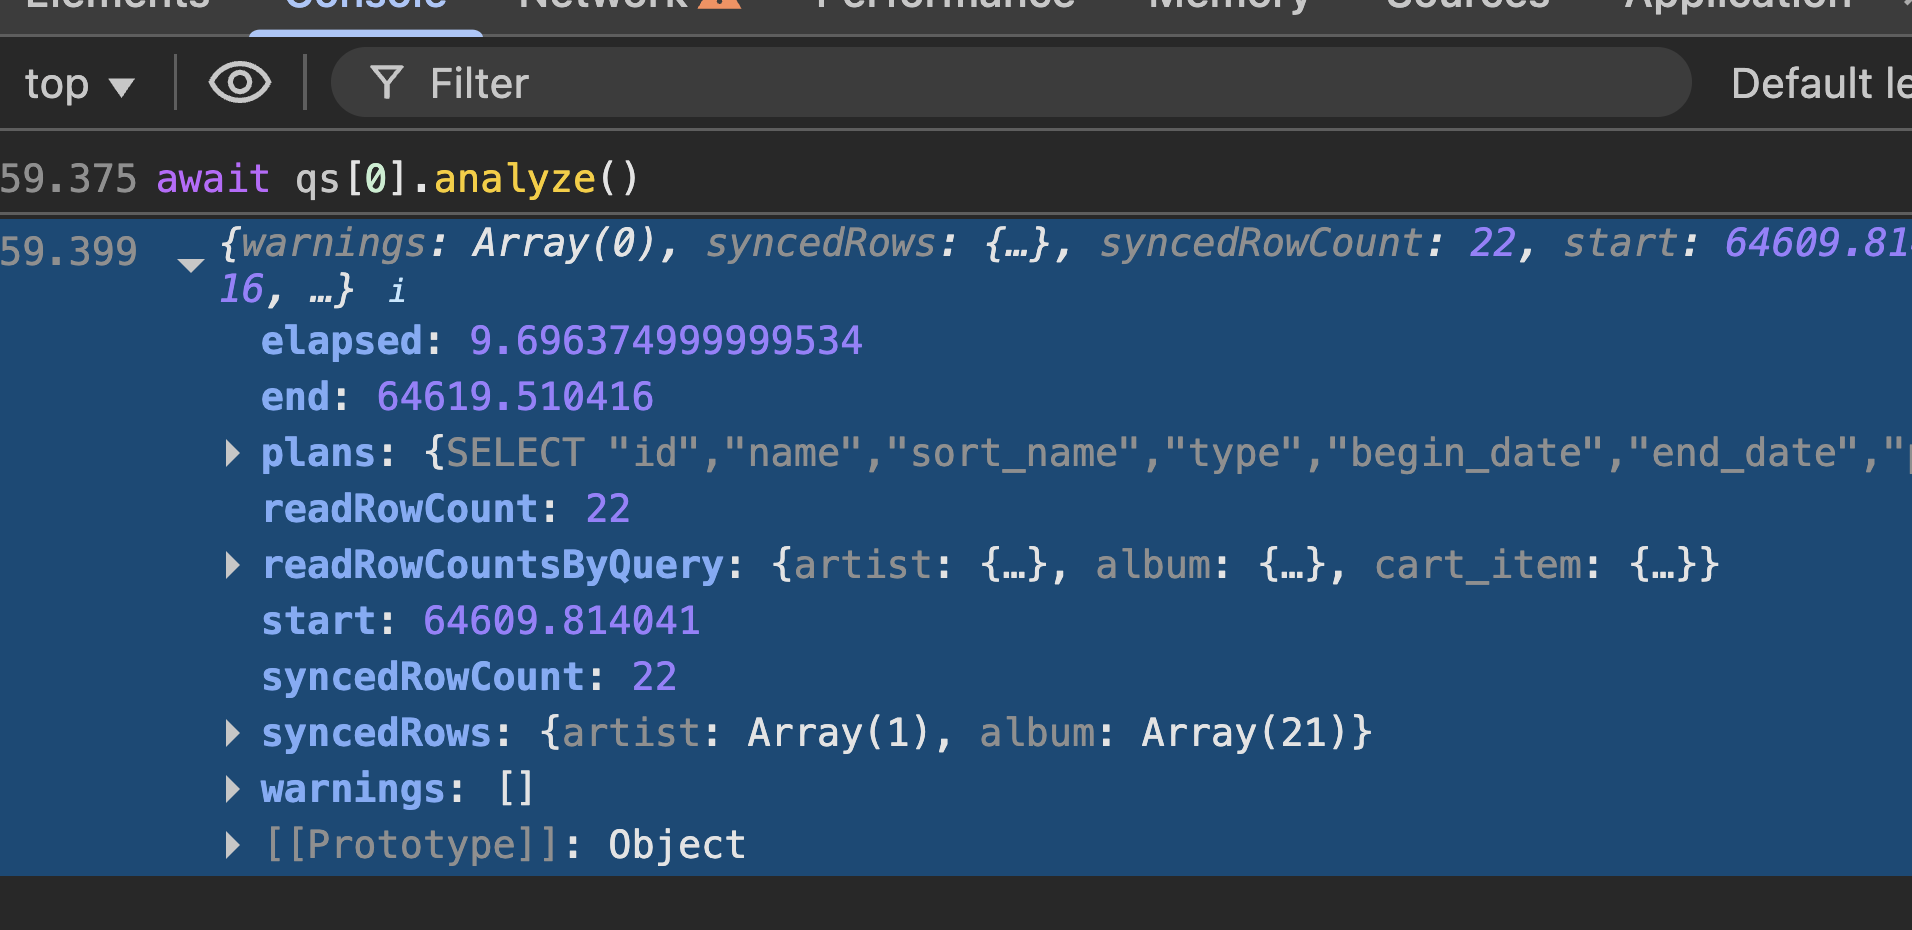
Here are some of the most useful fields in the output:
| Field | Description |
| ---------------------- | --------------------------------------------------------------------------------------------------------------------------------------------------------------------------------------------------------------------------------------------------------------------------------- |
| `elapsed` | Total time to run the analysis in milliseconds. This is a good proxy for to how long the query will takes to hydrate in your app. |
| `readRowCount` | Total number of rows read from the replica to find the synced rows. This is often the most important number for performance, since it reflects how much work Zero has to do to hydrate the query. We generally want this to be a small single-digit multiple of `syncedRowCount`. |
| `readRowCountsByQuery` | Number of rows read by each SQLite query. |
| `syncedRowCount` | Number of rows actually synced to the client for this query. |
| `syncedRows` | The actual rows synced. |
| `plans` | The output from SQLite's [`EXPLAIN QUERY PLAN`](https://www.sqlite.org/eqp.html) for each SQLite query used, which can help you understand why the query is reading more rows than necessary |
## Analyzing Arbitrary ZQL
You can also analyze arbitrary ZQL, not just queries that are currently active:
```ts
await __zero.inspector.analyzeQuery(
__builder.issues.whereExists('labels', q =>
q.id.equals('sync')
)
)
```
This is useful for exploring alternative query constructions to optimize performance.
To use this, you will first have to expose your `builder` as a property of the global object, so that you can access it from the console. For example:
```ts
// schema.ts
// ...
const g = globalThis as any
g.__builder = builder
```
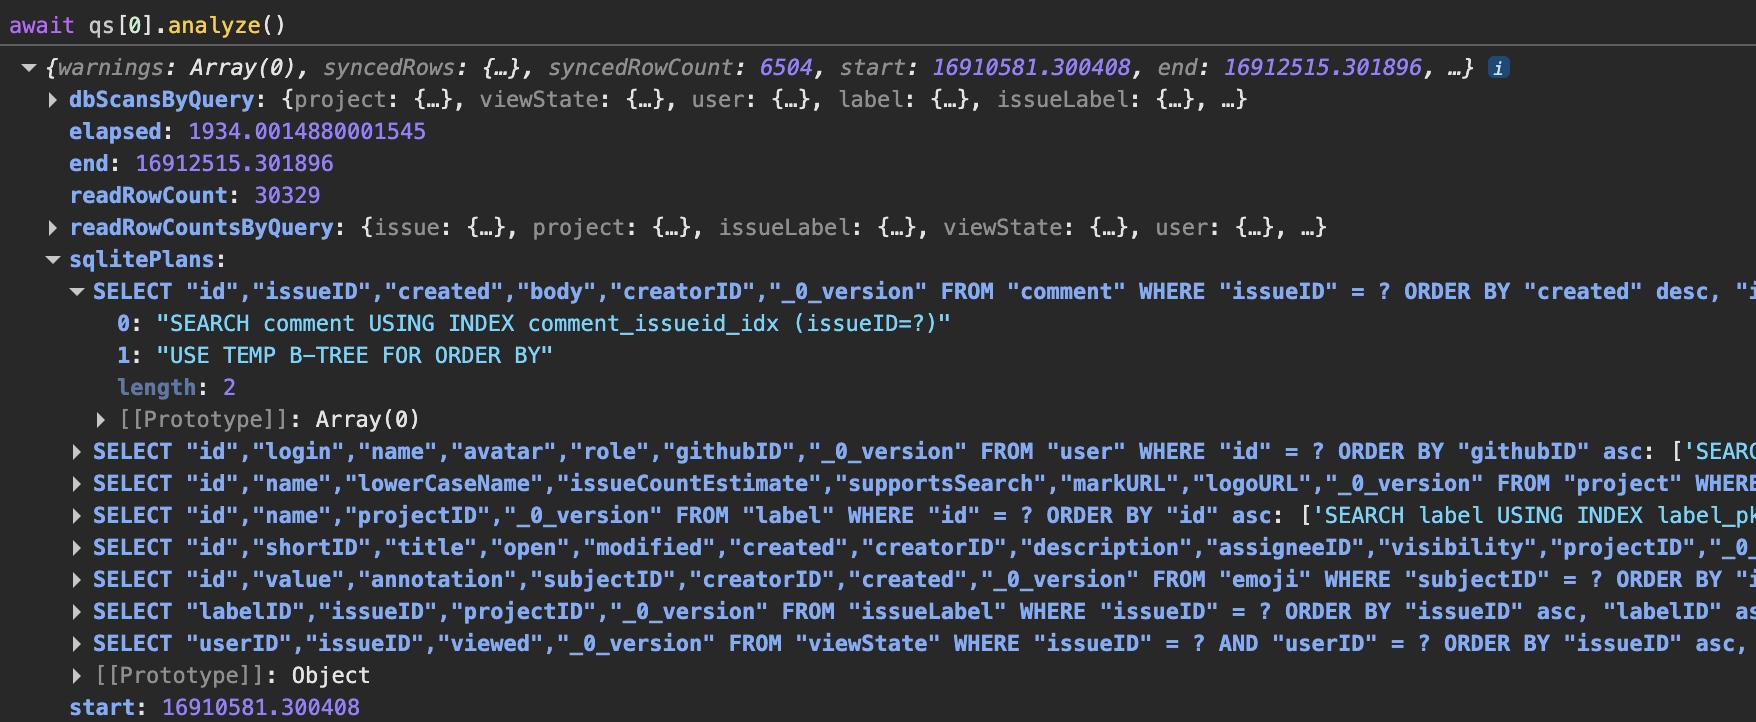
## Analyzing Query Plans
A Zero query is composed of one or more single-table queries connected by joins (`related`, `whereExists`).
Zero delegates the single-table queries to `SQLite`, which has a sophisticated query planner that chooses the best indexes to use.
For the joins, Zero implements its own cost-based planner to choose the best join order and algorithm.
To view the plans selected by `SQLite`, see the `sqlitePlans` field returned by `analyze()` or `analyzeQuery()`. This contains the output of SQLite's [`EXPLAIN QUERY PLAN`](https://www.sqlite.org/eqp.html) command for each SQLite query used:
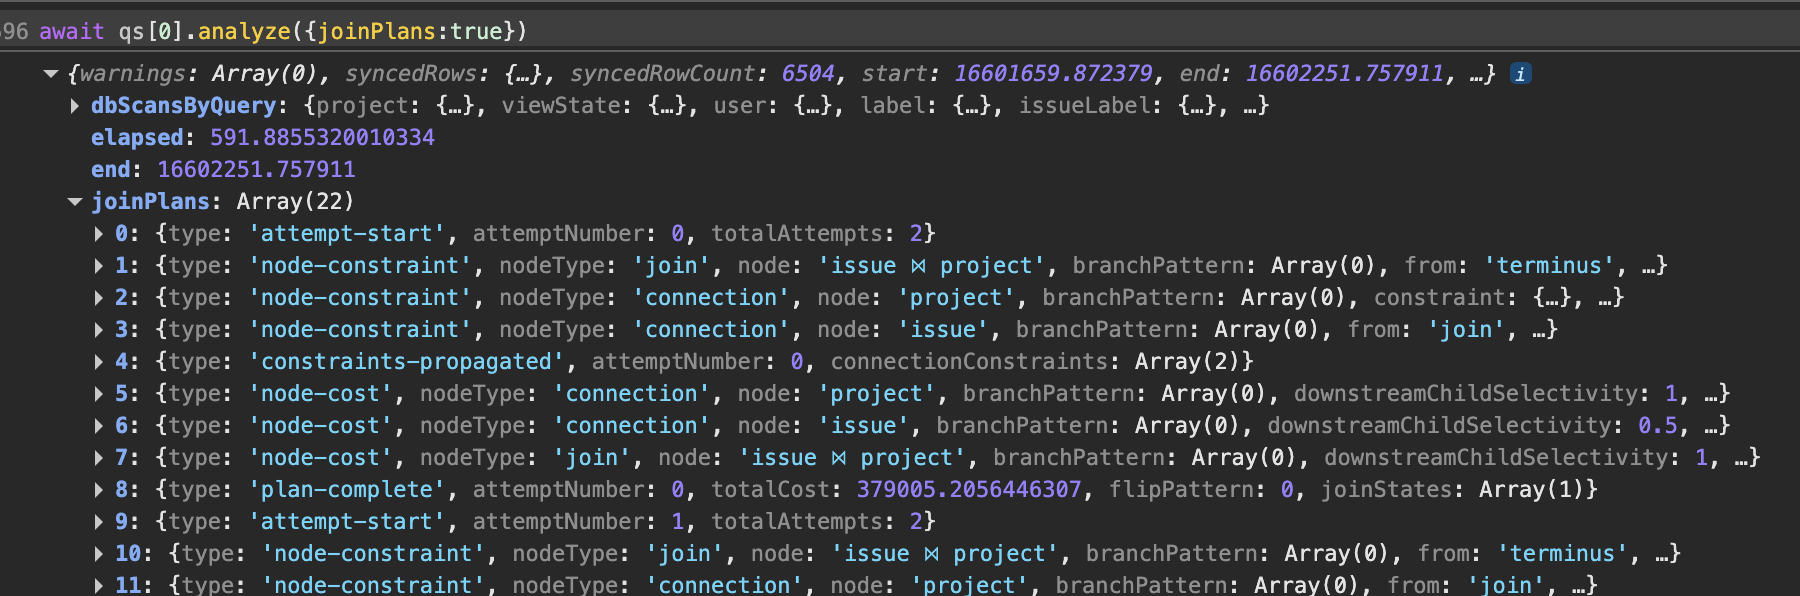
To view the join plan selected by Zero, call `analyze()` or `analyzeQuery()` with the `joinPlans` option set to true and see the `joinPlans` field in the output:
## Table Data
In addition to information about queries, you can get direct access to the contents of the client side database.
```ts
const client = __zero.inspector.client
// All raw k/v data currently synced to client
console.log('client map:')
console.log(await client.map())
// kv table extracted into tables
// This is same info that is in z.query[tableName].run()
for (const tableName of Object.keys(__zero.schema.tables)) {
console.log(`table ${tableName}:`)
console.table(await client.rows(tableName))
}
```
## Server Version
Ask the server to confirm what version it is:
```ts
console.log(
'server version: ',
await inspector.serverVersion()
)
```
Or, for AI assistants
ALWAYS readllms.txtfor curated documentation pages and examples.
Zero includes a rich inspector API that can help you understand performance or behavior issues you are seeing in your apps.
Use the analyze method to get information about how a query hydrates:
await qs[0].analyze()
Analyzing a query
Here are some of the most useful fields in the output:
Field
Description
elapsed
Total time to run the analysis in milliseconds. This is a good proxy for to how long the query will takes to hydrate in your app.
readRowCount
Total number of rows read from the replica to find the synced rows. This is often the most important number for performance, since it reflects how much work Zero has to do to hydrate the query. We generally want this to be a small single-digit multiple of syncedRowCount.
readRowCountsByQuery
Number of rows read by each SQLite query.
syncedRowCount
Number of rows actually synced to the client for this query.
syncedRows
The actual rows synced.
plans
The output from SQLite's EXPLAIN QUERY PLAN for each SQLite query used, which can help you understand why the query is reading more rows than necessary
A Zero query is composed of one or more single-table queries connected by joins (related, whereExists).
Zero delegates the single-table queries to SQLite, which has a sophisticated query planner that chooses the best indexes to use.
For the joins, Zero implements its own cost-based planner to choose the best join order and algorithm.
To view the plans selected by SQLite, see the sqlitePlans field returned by analyze() or analyzeQuery(). This contains the output of SQLite's EXPLAIN QUERY PLAN command for each SQLite query used:
SQLite EXPLAIN QUERY PLAN output
To view the join plan selected by Zero, call analyze() or analyzeQuery() with the joinPlans option set to true and see the joinPlans field in the output:
In addition to information about queries, you can get direct access to the contents of the client side database.
const client = __zero.inspector.client// All raw k/v data currently synced to clientconsole.log('client map:')console.log(await client.map())// kv table extracted into tables// This is same info that is in z.query[tableName].run()for (const tableName of Object.keys(__zero.schema.tables)) { console.log(`table ${tableName}:`) console.table(await client.rows(tableName))}


