In this section, we show the data that we use for drawing or generating Python charts using Pandas and matplotlib libraries. As you can see, we used three queries against SQL Server to get data from desired tables.
In all our Pandas DataFrame plot functions and matplotlib charts, we use either one of the Python data or all of them (depending upon the scenario).
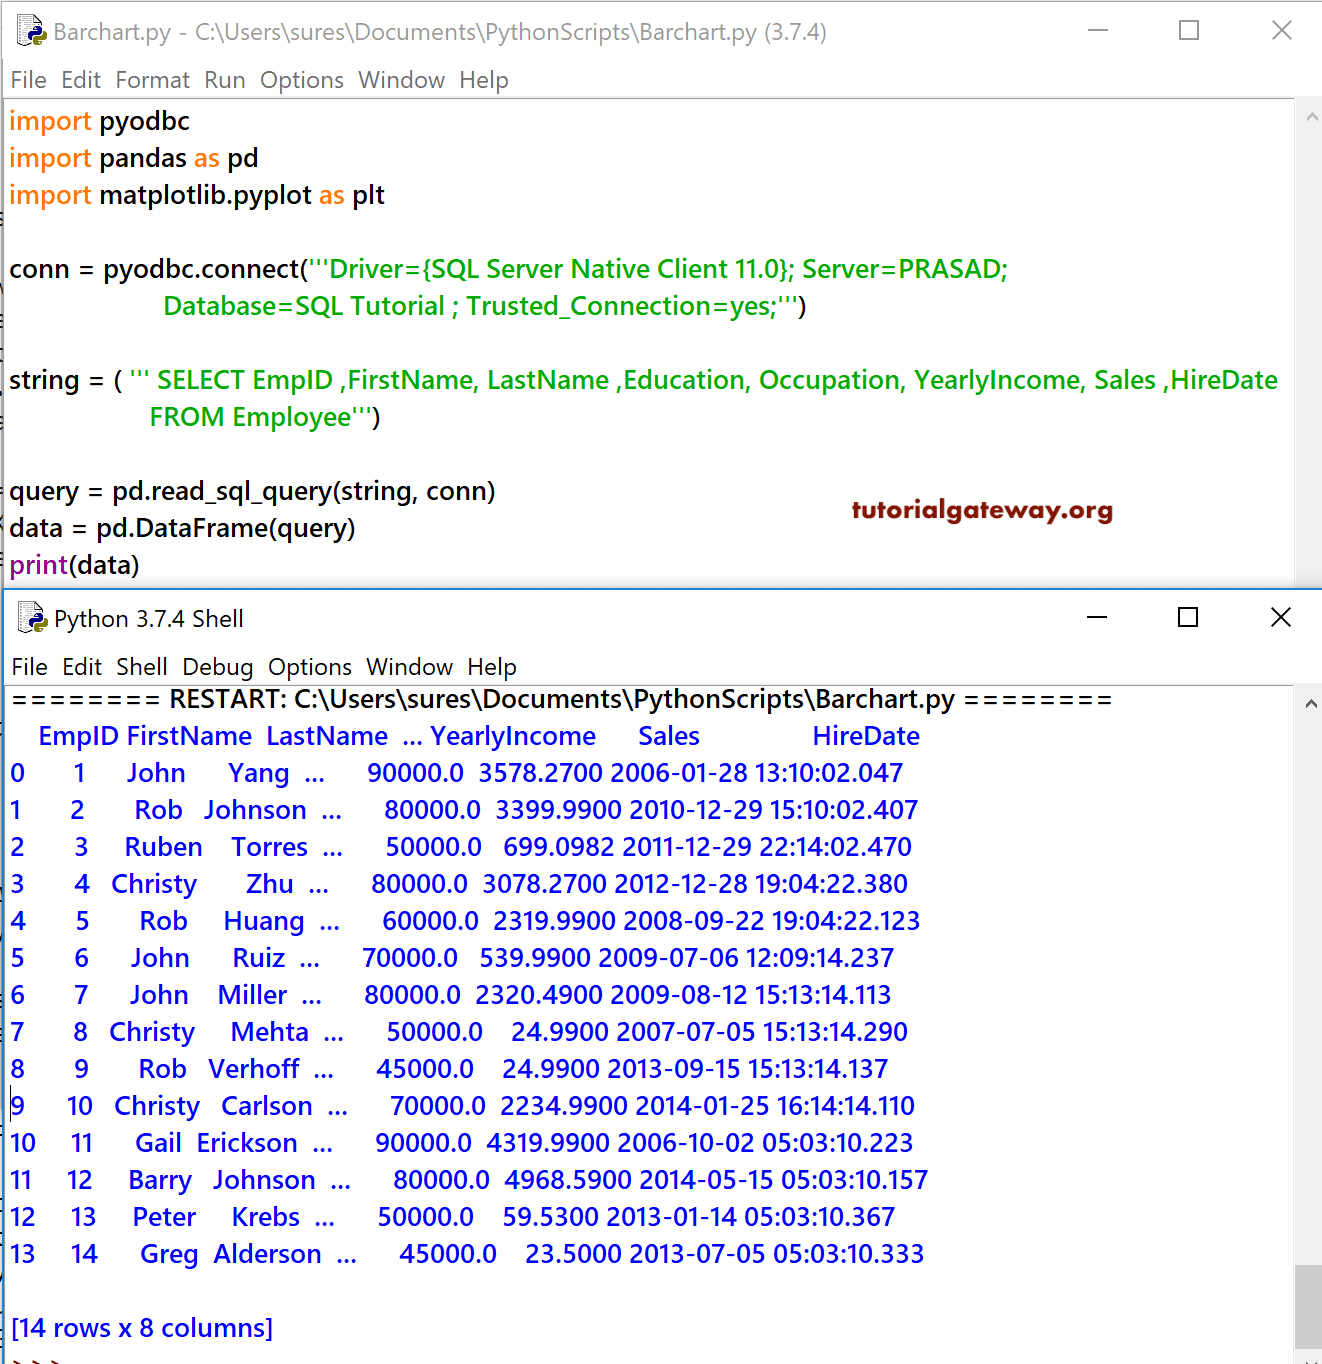
First, we select all the columns from the Employees Table from our SQL Tutorial database. This table holds 8 columns and 15 rows.
The query behind the below image is:
SELECT [EmpID] ,[FirstName], [LastName],[Education],
       [Occupation], [YearlyIncome], [Sales] ,[HireDate]
   FROM [SQL Tutorial].[dbo].[Employee]

How to Load SQL Data and use it in Python Charts?
Now, let me show you how to get this data into the Python workspace. To use the above data, we have to convert that data to a DataFrame. It involves multiple steps, first, establish an ODBC connection with SQL Server and the appropriate Database. Second, write a query to select the required fields from a Database Table. Finally, convert that Python charts data to Pandas DataFrame.
# Python charts data
import pyodbc
import pandas as pd
import matplotlib.pyplot as plt

conn = pyodbc.connect('''Driver={SQL Server Native Client 11.0}; Server=PRASAD;
                      Database=SQL Tutorial ; Trusted_Connection=yes;''')

string = ( ''' SELECT EmpID ,FirstName, LastName ,Education, Occupation, YearlyIncome, Sales ,HireDate
                    FROM Employee''')

query = pd.read_sql_query(string, conn)
data = pd.DataFrame(query)
print(data)
Since we are selecting all the columns, we may use SELECT * to save some space in the source code. Remember, it isn’t very nice to use SELECT * queries in SQL Server. I suggest you refer to the SQL Select Statement to understand the same.
Here, We are using the AdventureWorksDW2014 database, which is the data we use in most of the charts we generate using the Python matplotlib.
SELECT ProdCat.EnglishProductCategoryName, ProdSubCat.EnglishProductSubcategoryName, Geo.EnglishCountryRegionName,
       Geo.StateProvinceName, Geo.City, Geo.PostalCode, Prod.EnglishProductName, Prod.Color, Prod.DealerPrice,
       Cust.FirstName, Cust.LastName, Cust.Gender, Cust.YearlyIncome, Cust.EnglishEducation, Cust.EnglishOccupation,
       Fact.OrderQuantity, Fact.TotalProductCost, Fact.SalesAmount, Fact.TaxAmt, Fact.OrderDate
FROM DimProductSubcategory AS ProdSubCat
	INNER JOIN DimProduct AS Prod ON ProdSubCat.ProductSubcategoryKey = Prod.ProductSubcategoryKey
   INNER JOIN DimProductCategory  AS ProdCat ON ProdSubCat.ProductCategoryKey = ProdCat.ProductCategoryKey
   INNER JOIN FactInternetSales AS Fact ON Prod.ProductKey = Fact.ProductKey
   INNER JOIN DimCustomer AS Cust ON Fact.CustomerKey = Cust.CustomerKey
   INNER JOIN DimGeography AS Geo ON Cust.GeographyKey = Geo.GeographyKey
Let me show you the Adventure Works tables data for Python charts in Pandas DataFrame
import pyodbc
import pandas as pd
import matplotlib.pyplot as plt

conn = pyodbc.connect("Driver={SQL Server Native Client 11.0}; Server=PRASAD;"
                      "Database=AdventureWorksDW2014 ; Trusted_Connection=yes;")

string = ( ''' SELECT ProdCat.EnglishProductCategoryName, ProdSubCat.EnglishProductSubcategoryName,
                    Geo.EnglishCountryRegionName, Geo.StateProvinceName, Geo.City, Geo.PostalCode,
                    Prod.EnglishProductName, Prod.Color, Prod.DealerPrice, Cust.FirstName, Cust.LastName,
                    Cust.Gender, Cust.YearlyIncome, Cust.EnglishEducation, Cust.EnglishOccupation, Fact.OrderQuantity,
                    Fact.TotalProductCost, Fact.SalesAmount, Fact.TaxAmt, Fact.OrderDate
                    FROM DimProductSubcategory AS ProdSubCat
                    INNER JOIN DimProduct AS Prod ON ProdSubCat.ProductSubcategoryKey = Prod.ProductSubcategoryKey
                    INNER JOIN DimProductCategory  AS ProdCat ON ProdSubCat.ProductCategoryKey = ProdCat.ProductCategoryKey
                    INNER JOIN FactInternetSales AS Fact ON Prod.ProductKey = Fact.ProductKey
                    INNER JOIN DimCustomer AS Cust ON Fact.CustomerKey = Cust.CustomerKey
                    INNER JOIN DimGeography AS Geo ON Cust.GeographyKey = Geo.GeographyKey''')

query = pd.read_sql_query(string, conn)
data = pd.DataFrame(query)
print(data)
If you observe the below table, there are almost 20 columns and 60,398 rows. For the demonstration purpose, we can’t use all those columns so, we go with a maximum of 4 columns. I mean a shorter version of the above query with probably fewer joins. I hope you understand.

In some cases, we might use the following table as well. So, let me show you the same
