


Out-of-the-box visualizations
Interactive and engaging for end users
Dynamic dashboards enable your end users to explore data from different perspectives:
- Drag and drop to change metrics, dimensions, or data visualization types from the out-of-the-box options.
- Add filters to entire dashboards or just a single visualization.
- Drill deeper into a visualization to examine the underlying data in more detail.
- Create aggregations (eg., sum, average) from pre-made metrics.
With your branding
Use dashboard theming to match your brand — fonts, colors, logos — in just a few clicks.
With live data
The freshest data at the click of a button ensures that end-users' dashboards and visualizations are always up to date.
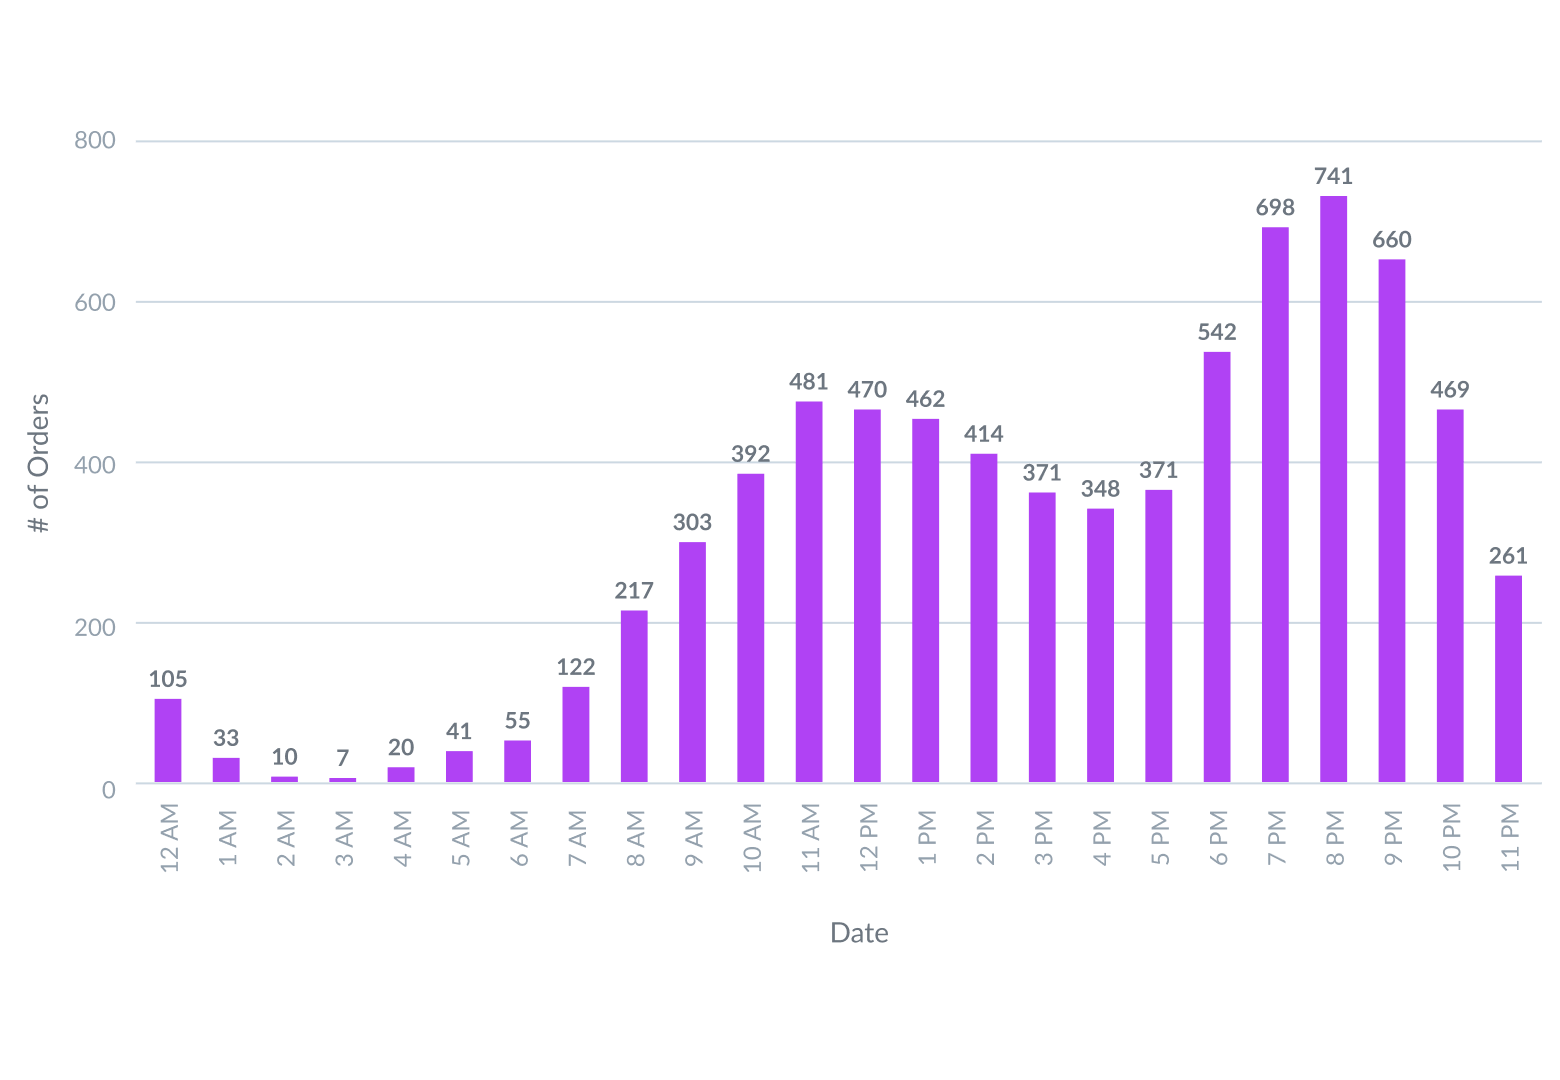
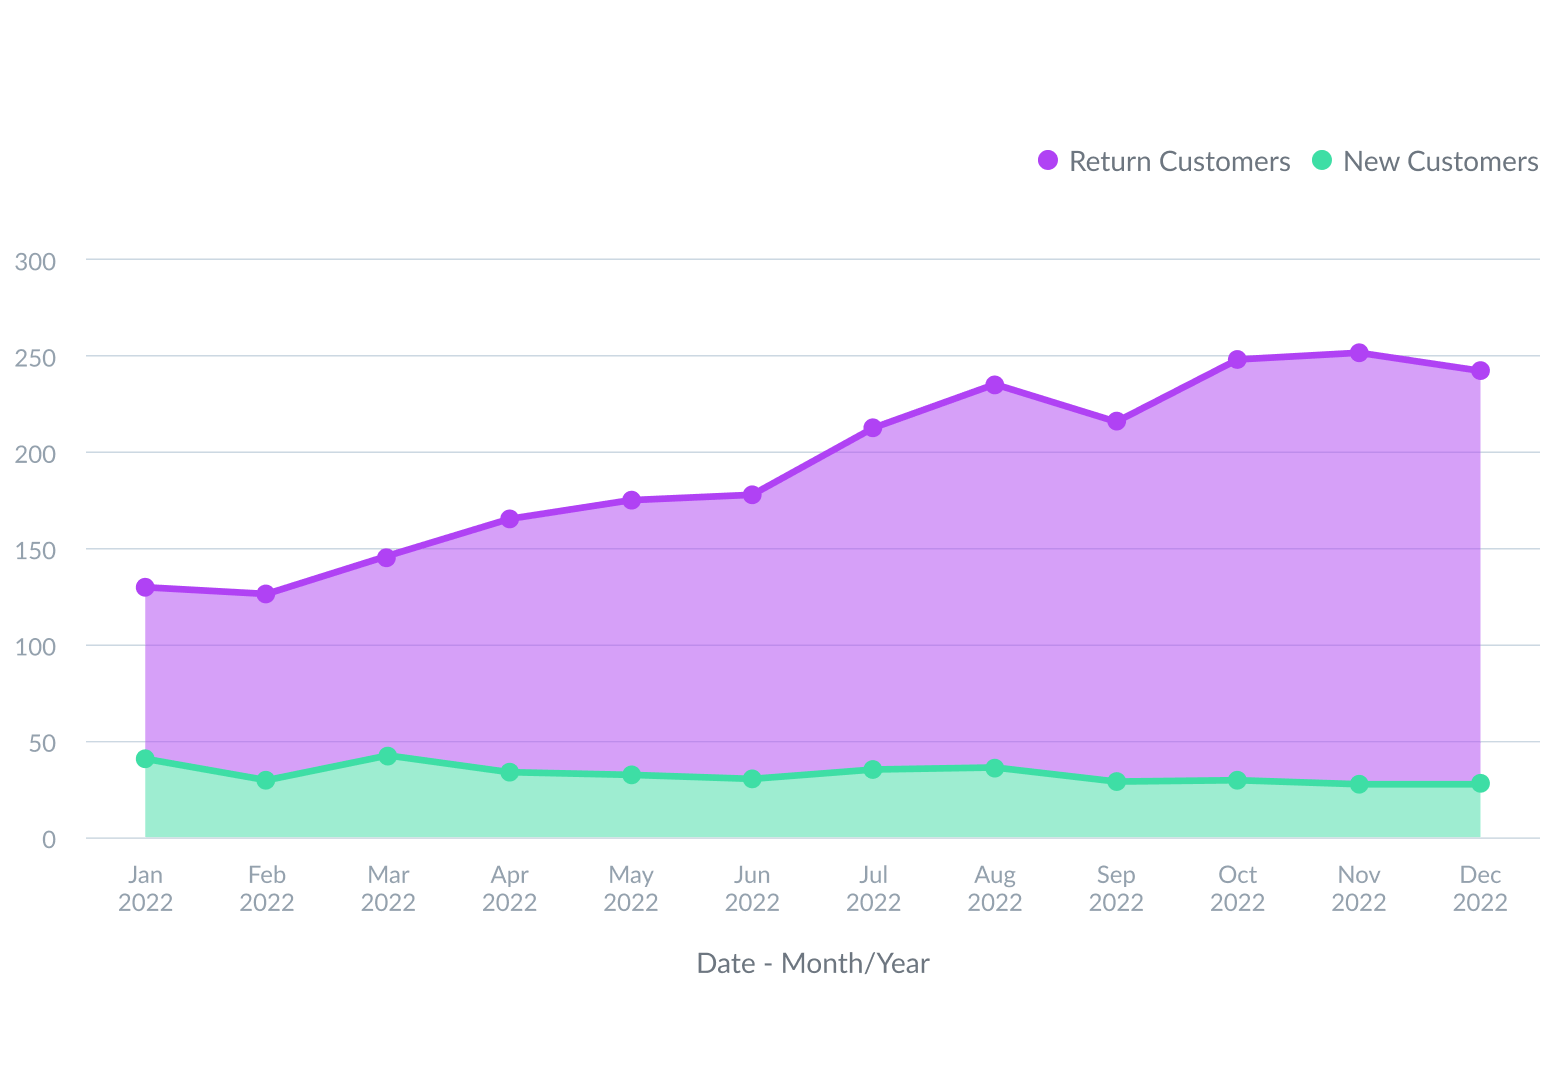
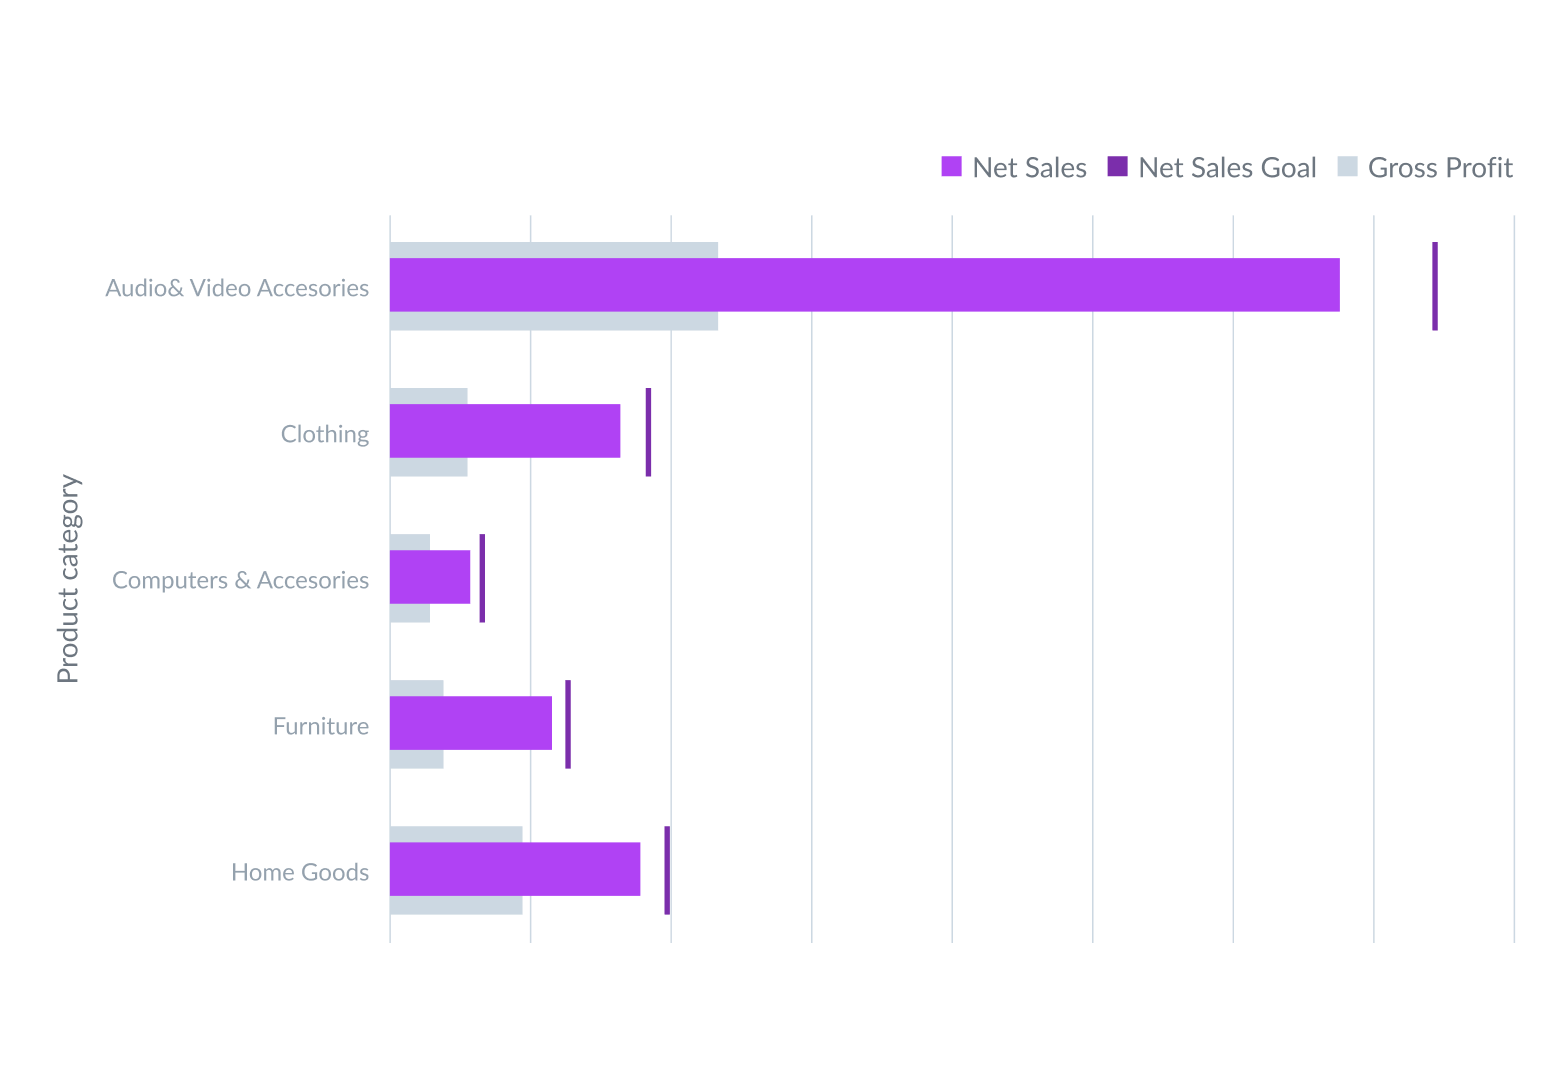
Choose from GoodData’s out-of-the-box visualizations


Custom visualizations
Tailor-made to your exact needs — without limits
In addition to the out-of-the-box data visualization types, you can customize your dashboards with charts from any external visualization library.
GoodData’s visualization tool is designed for creating advanced, custom-crafted dashboards, and complex business reporting solutions.
Add and augment any data visualization from any charting library with only a few lines of code — D3, Chart.js, FusionCharts, Google Charts and more.