
While engagement metrics and KPIs are important for any email, SMS, or ad campaign, we know that connecting those results back to conversions and attributed revenue is often top of mind.
Across your Hive account, you’ll find several places where you can review attributed revenue tied to your marketing initiatives.
Setting up revenue tracking
In order for Hive to collect revenue data, you’ll need to:
Connect your ticketing platform via an integration, or
Connect your e-commerce store (such as Shopify) via an integration, or
Manually import event revenue if Hive doesn’t connect directly to your tool
How attributed revenue works
When you send a campaign from Hive that links to your ticketing or e-commerce platform, Hive automatically tracks whether a contact engaged with the campaign and then made a purchase from the linked URL.
Hive uses a last-touch attribution model with a 5-day conversion window. This means the last Hive campaign a contact engaged with before purchasing will receive the attributed revenue, as long as the purchase happens within 5 days.
Example: If you email Sally a list of your upcoming shows, and then a couple of days later she receives an SMS promoting those same shows, the last touch matters. If Sally makes a purchase within 5 days of clicking on the SMS, the revenue will be attributed to the SMS campaign, not the email.
Note: If the contact only has a phone number (no email), we won’t be able to tie ticket purchase revenue back to them.
Revenue metrics breakdown
Metric | Definition |
Total revenue | Total revenue is attributed to the specific campaign, segment, or event.
|
Number of orders | The total number of orders placed follows the same attribution model as total revenue. |
Average order size | The average order size shows the average dollar value generated per order. It is calculated by dividing total revenue by the total number of orders placed. |
Average revenue per recipient/contact | The average revenue per recipient (in email reporting) or per contact (in segment reporting) shows the average revenue generated per person. It is calculated by dividing total revenue by the number of email recipients or contacts in a segment. |
Average number of orders per contact | The average number of orders per contact (in segment stats) is calculated by dividing the total number of orders by the total number of contacts in that segment. |
Where you can view your attributed revenue
There are several places in Hive where you can review total revenue as well as revenue attributed back to your campaigns, segments, and events.
Segments
From the Segments page, click View Segment Stats to see a filtered view of the contacts in that segment. This view includes information about the revenue generated by those contacts.
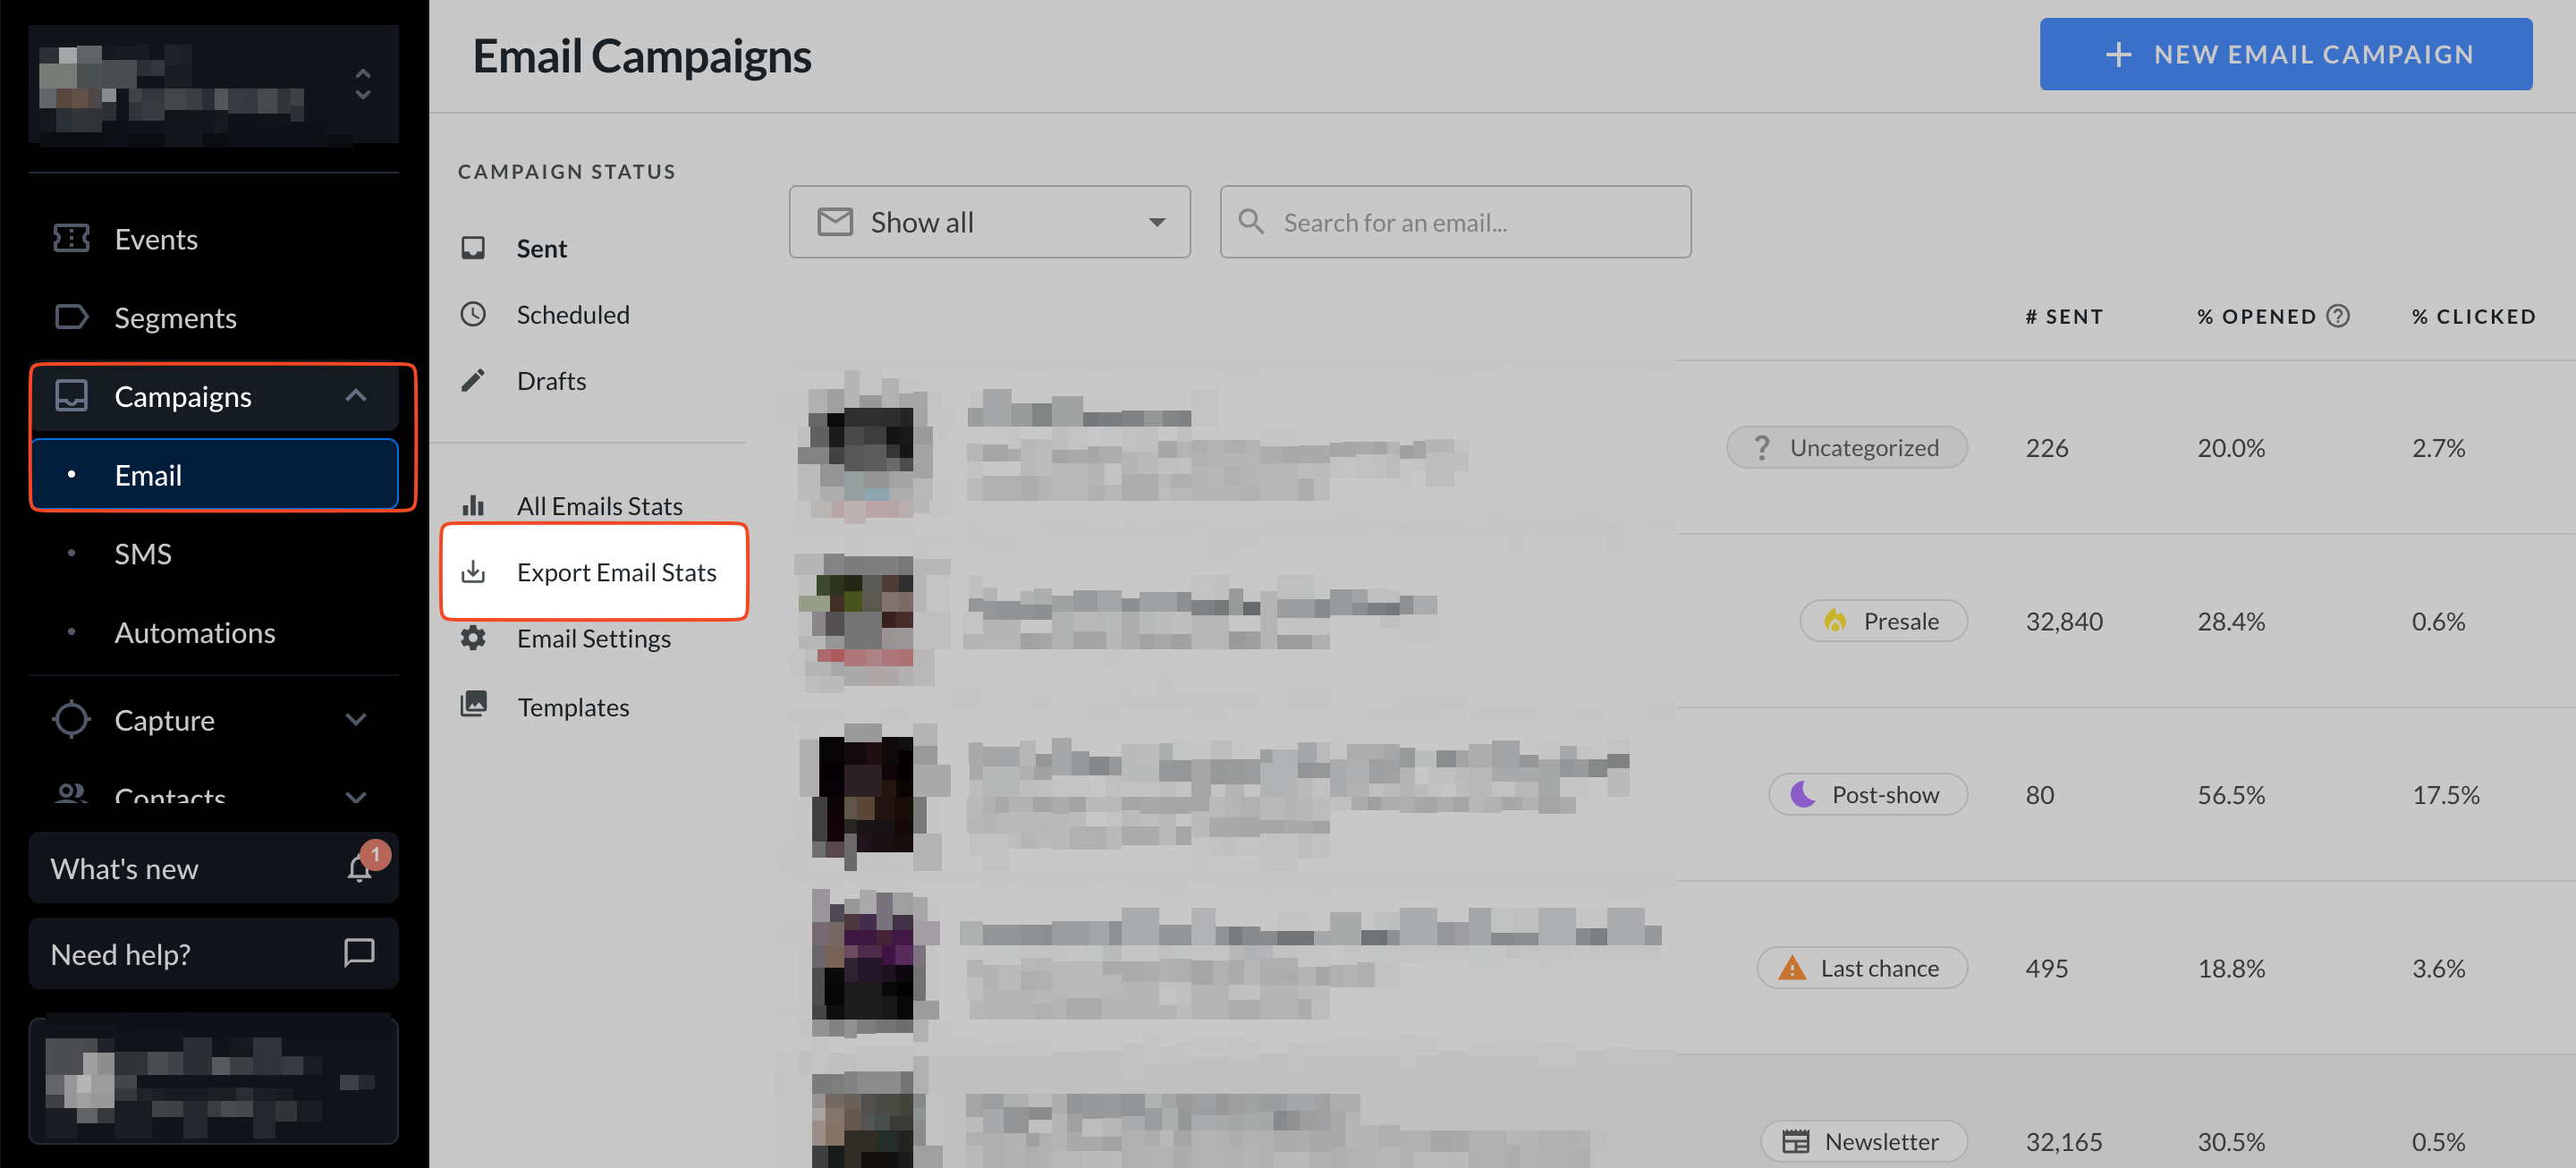
Email and SMS pages
On the main email and SMS campaign pages, you can view the total revenue generated by each campaign.
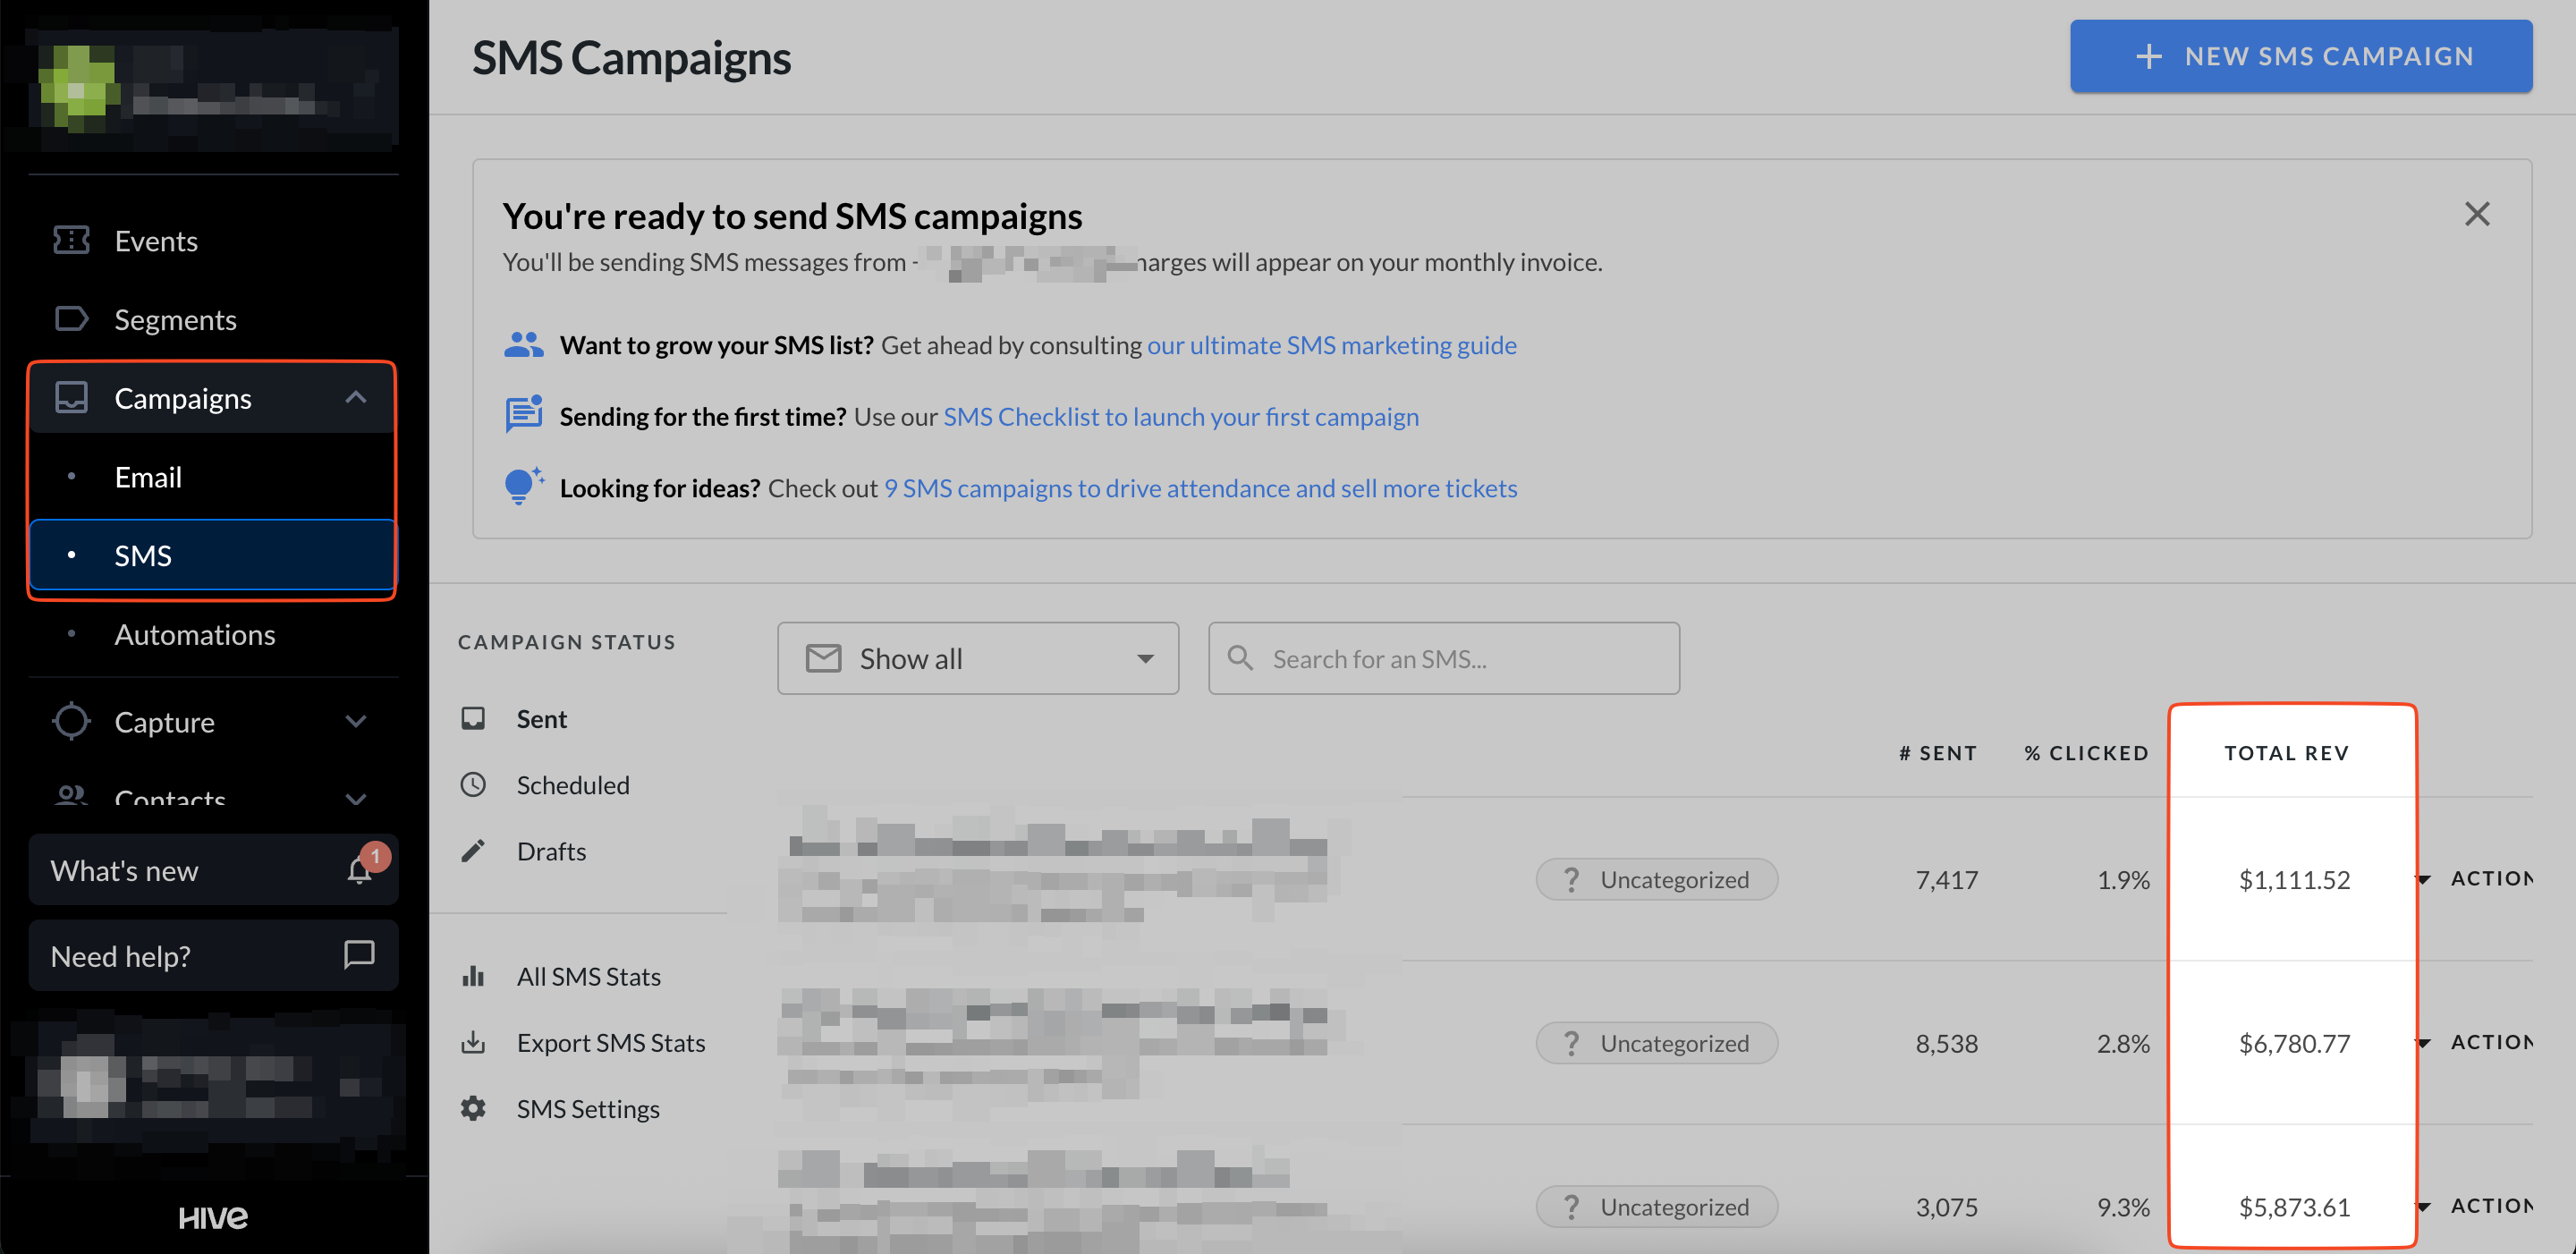
After sending an email or SMS, click on the campaign title to see detailed revenue insights.
For more information, see this article on viewing email campaign reports.
Email and SMS exports
You can export your attributed revenue data by clicking Export email stats
And/or export SMS stats.

Event hub
On the Events page, click the event title to open that event’s hub. In the left-hand panel, you’ll see both the total revenue generated and the revenue attributed back to Hive campaigns.
To view a more detailed breakdown, scroll down to the Marketing Activities section. Here you’ll find all tracked marketing initiatives tied to that event, along with the revenue generated at the campaign level.
For more information, see this article on navigating the event hub.
Analytics
From the Analytics page, you can view a high-level overview of all revenue generated in the past 7 days, as well as the revenue attributed back to Hive marketing email campaigns and automations.