
Your analytics page gives you a snapshot of recent performance across campaigns, subscribers, engagement, and revenue.
Feature overview
At the top of the Analytics page, you’ll see tiles that summarize key features in your Hive account:
Revenue from email (past 7 days)
Revenue from sms (past 7 days)
Email performance (average open rate, past 7 days)
Deliverability at risk
Custom subdomain status
Welcome automation status
Winback automation status

Pro tip: Treat these tiles like a quick onboarding checklist. Green means it’s configured and data is flowing. Orange indicates a feature isn’t active yet.

Subscriber growth and engagement level
In this section, view new email subscribers (from the last 7 days), total subscribers, and invalid/unsubscribed counts. You can also break down your total subscribers by engagement levels such as active, at risk, and inactive. For definitions of engagement levels, check out this help article.

Pro tip: Avoid regularly emailing inactive contacts—this can hurt deliverability and increase spam placement. If your at risk or unsubscribed segments are growing, review this help article on re-engagement strategies.
Click view list growth to open a detailed chart of your subscriber growth, with weekly, monthly, yearly, or custom date views.

Email performance
This section shows a 7-day summary of email volume, average open rate, and average click rate.

Click view email performance to jump to your main email page for a per-campaign breakdown and KPIs. For more on email reporting and data, check out this help article.
Revenue (email)
View total revenue from your ticketing integration (or imported event data) and revenue attributed to email campaigns/automations over the last 7 days.
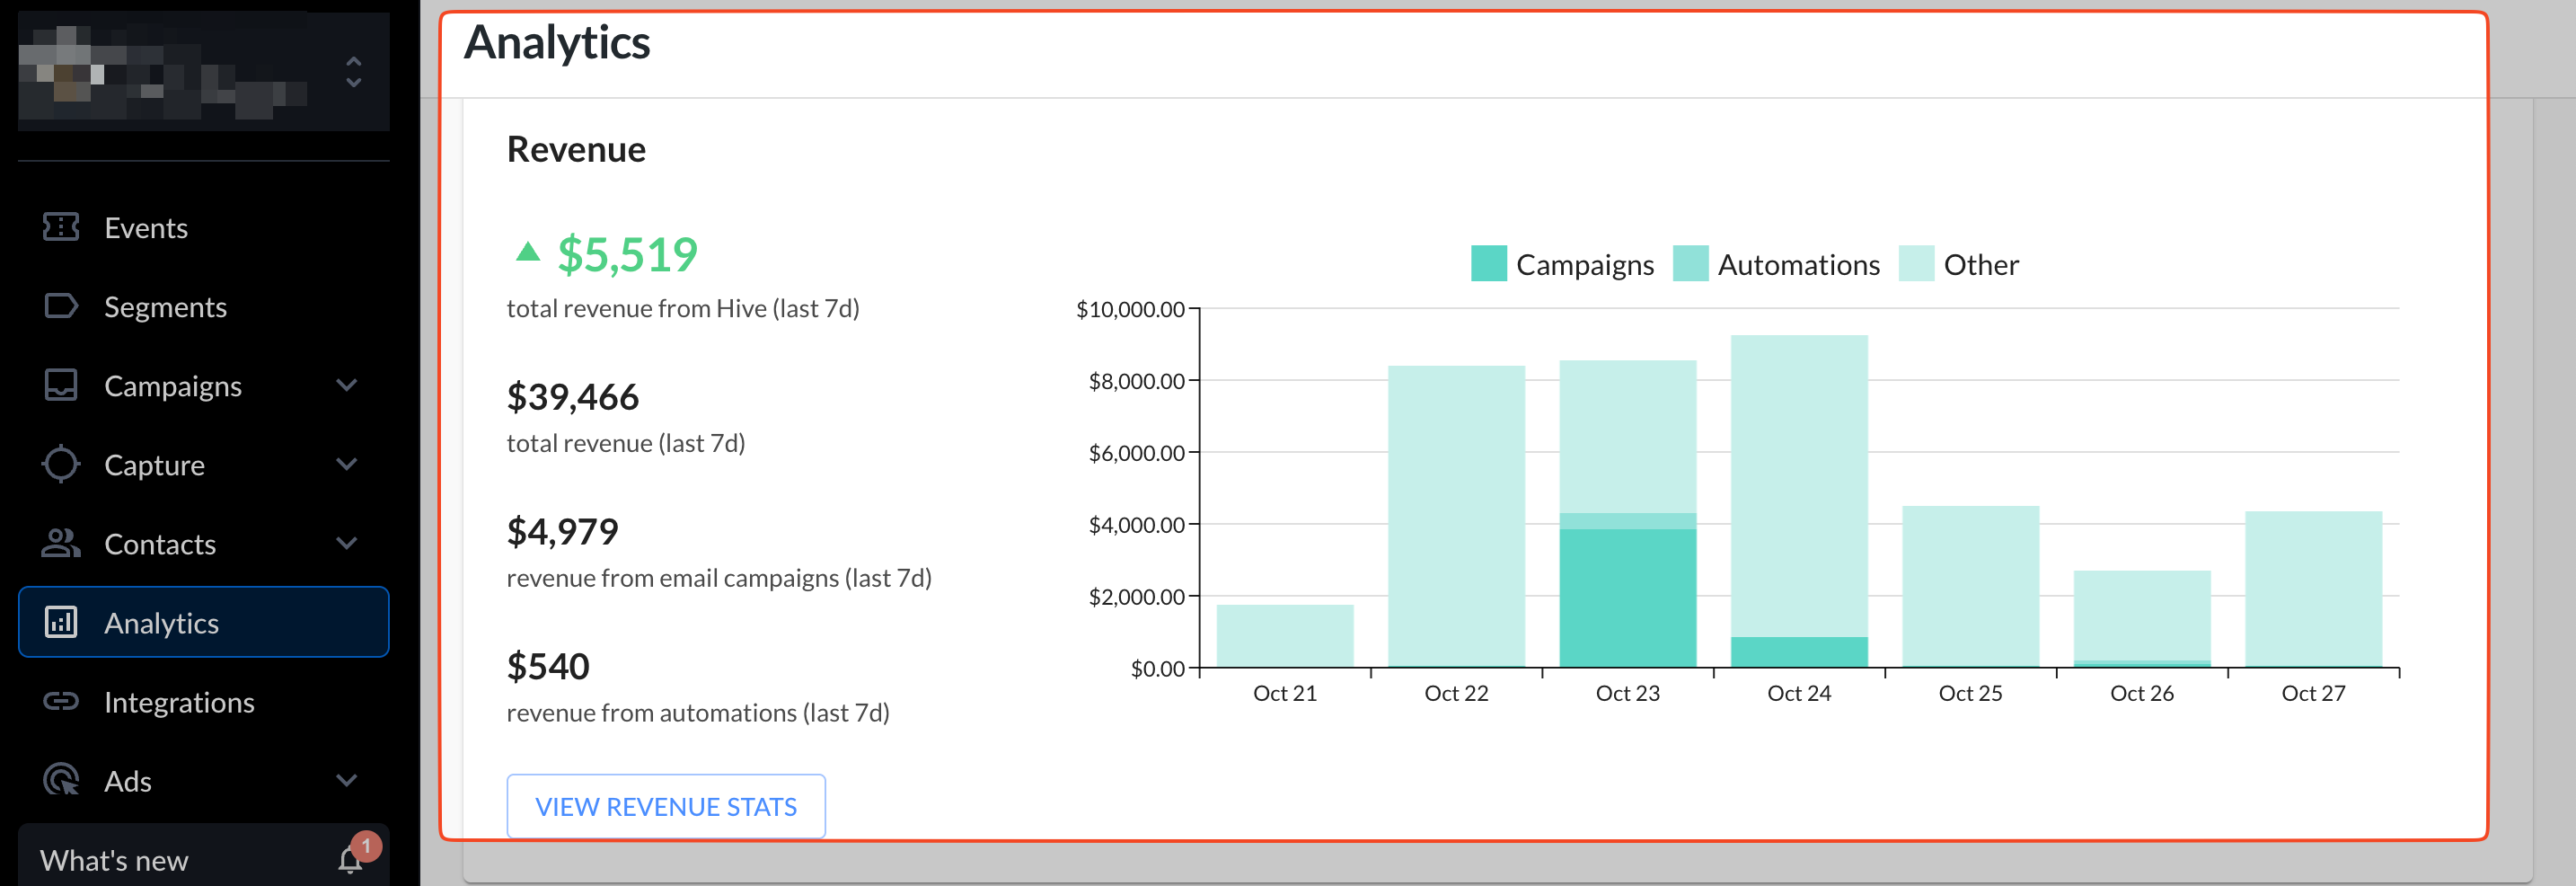
Click view revenue stats to open full account revenue reporting. From there, apply filters to analyze specific groups of contacts.

SMS list growth
Review your SMS subscriber growth. By default, the chart shows the last 7 days; adjust the date filters to expand the window.

Hover over the most recent data point to see the current count of SMS subscribers in your account.
Need help growing your SMS subscriber list? Check out this help article for tips and tricks.